J.ophthalmol.(Ukraine).2017;6:11-15.
|
https://doi.org/10.31288/oftalmolzh201761115 Investigation of optical density of aqueous humor samples from patients with combined cataract and POAG and those with cataract only with the use of spectroscopy V.O. Mel’nik, Cand Sc (Med) Visiobud+ Clinic LLC Kyiv, Ukraine Background: The importance of the subject is evidenced by the steadily increasing number of patients with primary-open angle glaucoma (POAG) and absence of a unified theory for the development of POAG. Purpose: To compare the absorption spectra of the aqueous humor (AH) samples from patients with combined cataract and POAG, and those from patients with cataract only, and to identify differences, if any, in parameters of these spectra between the two groups. Materials and Methods: AH samples were obtained from 96 patients (96 eyes including 36 eyes with combined cataract and POAG, and 60 eyes with cataract only), and their absorption spectra were investigated. Results: In the AH samples obtained from patients with combined cataract and POAG or those with cataract only, two absorption peaks were found at 202 nm and 267 nm. The mean optical density at 202 nm of the AH samples obtained from the former patients was higher than that of the samples obtained from the latter patients. The intergroup difference in the optical density at 202 nm (but not at 267 nm) of the AH samples was statistically significant. Conclusion: A statistically significant difference in the optical density of AH samples was found between patients with POAG and those without POAG based on the results of spectroscopy that can be regarded as a valuable adjunct in the diagnosis of patients with this disorder. Keywords: primary-open angle glaucoma, cataract, spectroscopy, optical density, aqueous humor pressure Introduction Glaucoma is one of the most important eye diseases, and the number of patients with primary-open angle glaucoma (POAG) has been increasing year by year [1]. This may be associated, in particular, with current demographic trends. Populations are aging [2] and the prevalence of the disease has been found to increase with age from 0.88 per 1000 at age 50-59 to 17.4 at age 71 and older [3]. The interest of ophthalmologists in glaucoma is caused by the variety of clinical forms, complexity of the pathogenesis, searching for innovative methods for early diagnosis and treatment, and medical and social importance of the disease [4]. Although a variety of studies have been undertaken (including investigations of changes in the trabecular meshwork and aqueous humor (AH) composition), a unified theory for the development of POAG is yet to be developed [5]. Proteomic analysis of the AH is a new approach in the research [6]. Matrix metalloproteinases are proteins that have been identified in the AH of POAG patients [7] as (1) facilitators of the lysis of basal membranes and hydrolysis of all the intercellular matrix components and (2) activators of the angiogenic growth factors associated with the matrix [8]. Vascular endothelial growth factor (VEGF) [9] and fibronectin [10] have been also identified in the AH of these patients. A number of analytical methods (including liquid chromatography with electrochemical detection [11], enzymatic [12] and spectroscopic [13] techniques) have been used to determine the concentration of the above substances in the AH. Most of these methods are technically laborious and require specialized equipment or can identify only one or two substances at a time. As some of the AH components like proteins (amino acid residues of tyrosine, tryptophan and phenylalanine), ascorbic acid and glutathione absorb ultraviolet light in the range of 200-300 nm, the ultraviolet absorption spectrum may be considered as an indicator of the integral metabolite concentration in the AH [5]. This paper is related to the identification of differences in the spectra of AH samples from patients with cataract only and those from patients with combined cataract and POAG The purpose of the study was to compare the absorption spectra of the AH samples from patients with cataract only and those from patients with combined cataract and POAG, and to identify differences in the parameters of these spectra (position of peaks and optical density of the aqueous fluid at the wavelengths of these peaks) between the two groups. Materials and Methods Of the 96 patients (96 eyes) included in the study, 58 (60%) were women (mean age, 66.9 years), and 38 (40%) were men (mean age, 65.2 years). Patients were divided in two groups. Group 1 involved 60 cataract-only patients (60 eyes) who had conventional phacoemulsification and intraocular lens (IOL) implantation. Group 2 involved 36 patients (36 eyes) with combined cataract and POAG who had modified tunnel trabeculopuncture (MTTP) with phacoemulsification and IOL implantation.
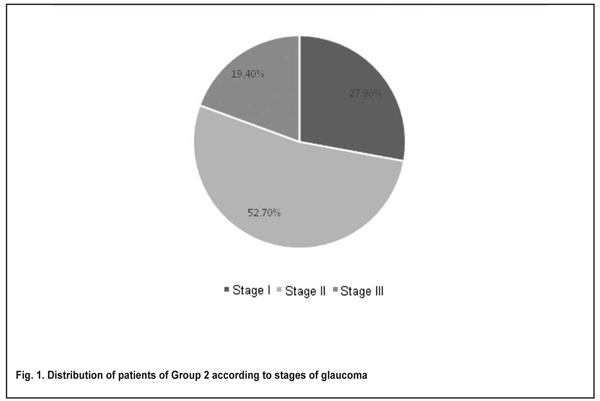
POAG stage was graded by the Nesterov and Bunin classification of 1975. The numbers and percentages of patients diagnosed with stage I, stage II and stage III glaucoma were 10 (27.9%), 19 (52.7%), and 7 (19.4%), respectively (Fig. 1). The numbers and percentages of patients with normal, moderately and markedly elevated IOP were 9 (25%), 16 (44.44%), and 11 (30.6%), respectively. Patients were observed during the preoperative period (range, 1 week to 1 month). Postoperatively, they received various types of topical medical hypotensive therapy with various instillation regimens. In addition, to prevent infectious complications, each patient had instillation of an antibacterial agent, Levofloxacin 0.5% (Oftaquix®, Santen Oy, Tampere, Finland) preoperatively and instillation of topical anesthetic, proparacaine hydrochloride 0.5% (Alcaine®, Alcon Laboratories, Fort Worth, Tex.) intraoperatively.
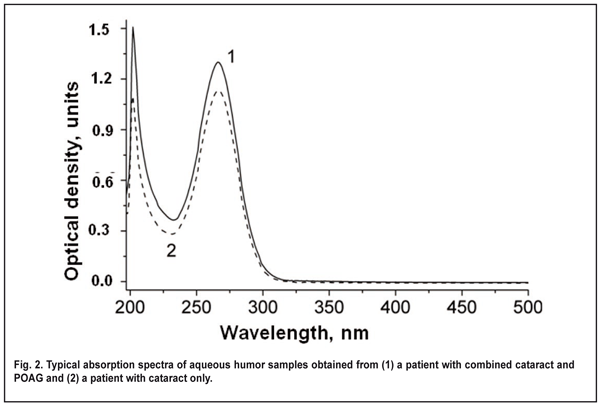
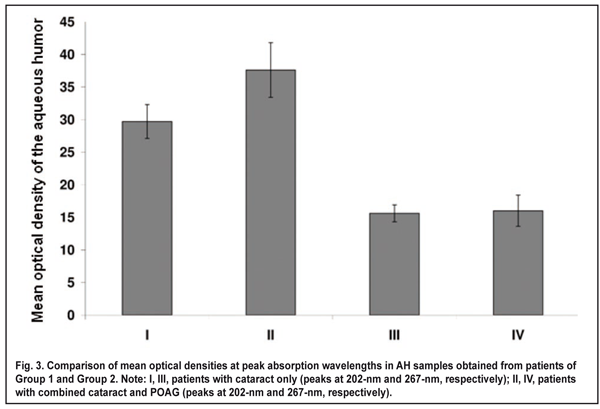
Aqueous humor samples of 10 to 200 ?l were obtained intraoperatively, immediately prior to cataract extraction. Before AH sampling, the ocular surface was rinsed with sterile normal saline, and dried with surgical gauze. Each sample of AH was obtained with an insulin syringe integrated with a 26-gauge needle inserted through the first paracentesis, transferred to a sterile Eppendorf tube, and transported to the laboratory. Postoperatively, there were no complications potentially related to intraoperative contamination. Samples were neither frozen nor sterilized before being kept in the fridge at 5°C. The time of sample collection and sample analysis was recorded for each sample. Unless otherwise noted, samples were analyzed 24 hours after sample collection. The absorption spectra of the AH samples (expressed as the relationship between the optical density of a solution and radiation wavelength in nanometers) were recorded in the spectral range of 190-1.100 nm using a Specord 210 Analytic (Jena AG, Germany) spectrophotometer. A 10-100-?L portion of the AH sample was placed into a 10-mm-thick quartz cuvette, diluted with normal saline (0.9% wt/vol sodium chloride solution in distilled water) to 2 ml, and mixed thoroughly. A similar cuvette was filled with normal saline solution that was used as a reference for optical density measurements. After measurement of each sample the cuvette was thoroughly rinsed with normal saline solution before the introduction of the next sample, and no peaks characteristic for investigated samples could be detected immediately after rinsing. As the exact levels of UV-absorbing substances in the AH are not known, and these substances may differ substantially in extinction coefficient, the optical density of each sample was recalculated for sample comparison, with the optical density of undiluted AH (hereinafter called optical density of the aqueous humor) to be used as a conventional unit of optical density. The following formula was used to determine the optical density of the AH) at ? wavelength (all mathematical equations used will be discussed in the Results and Discussion sections): А? = А? dilut V dilut Vportion, were А? dilut is the optical density of diluted aqueous humor at ? wavelength, V dilut (?l) is the volume of diluted fluid in the cuvette (2000 ?l in all samples), and Vportion (?l) is the volume of the portion of fluid under study. Statistical analysis of optical density of the AH was performed by comparing the confidence intervals (р < 0.05) of mean values among groups, and using an unpaired Student's t-test. Results We found absorption bands at 230-300 nm (with an absorption maximum at 267±1 nm) and at 190-220 nm (with an absorption maximum at 202±1 nm) in the UV absorption spectra of the AH samples obtained from patients of both groups. The presence of these absorption bands may be explained by UV absorption by (1) aromatic rings and systems of conjugated double bonds (???* transitions) in the organic particles [14] contained in AH, and (2) the fragments of organic molecules with saturated (?? ?* transitions) or non-conjugated (???* transitions) double bonds. As the AH samples obtained from different patients were found to have consistent spectrum shape and positions of absorption peaks (202±1 nm and 267±1 nm), these samples can be considered qualitatively robust. However, the samples were found to differ in the levels of AH components. The optical density at 202-nm and 267-nm in AH samples from patients of Group 1 was within 10.0 to 73.1 units, and 2.4 to 60.0 units, respectively, compared to 21.0 to 80.6 units and 5.4 to 30.2 units, respectively, in those from patients of Group 2. Mean optical density at 202-nm in AH samples obtained from patients of Group 2 was 27% higher than that in AH samples obtained from patients of Group 1 (37.6 ± 4.2 vs 29.7 ± 2.6, p < 0.05; Fig. 3). Mean optical density at 267-nm in AH samples obtained from patients of Group 1 and Group 2 was 15.6 ± 1.3 and 16.0 ± 2.4, respectively, with no statistically significant difference between the groups.
As per the Buger-Lambert-Beer law, the optical density of a solution is directly proportional to the concentration of the solute (the substance that absorbs irradiation) [14]. The difference in mean optical density at the peak absorption wavelength of 202 ± 1 nm between patients with cataract only (Group 1) and patients with combined cataract and POAG (Group 2) corresponds to higher mean level of the organic substances absorbing light at 202 nm in the AH samples obtained from the latter patients than in those obtained from the former patients. Given that increased IOP in glaucoma is potentially caused by reduced trabecular outflow [15] (due to increased number of cells covering the trabecular meshwork and Schlemm's canal [16], and increased accumulation of the extracellular material in both the trabecular meshwork and ciliary muscle and a loss of trabecular meshwork cells [17]), increased organic content in the AH samples may be also associated with a reduced rate of organic removal with the outflow and constant rate of organic production. Discussion A difference in the optical density at 202 ± 1 nm between the AH samples obtained from patients of Group 1 and Group 2 may indicate a difference in total concentration of the substances absorbing at this wavelength. The optical density at 202 ± 1 nm of the AH samples obtained from patients with POAG was significantly higher than that of the AH samples obtained from patients without POAG, which may be caused by a reduced AH outflow leading to accumulation of metabolites in the AH of the former patients. However, it should be noted that the difference in the optical density at 267 nm of the AH samples obtained from patients of the two groups was not statistically significant. The Bernulli equation describes the relationship between pressure and velocity in a system of laminar flow. The velocity of fluid flow in a system of pipes depends on the optical density of a solution which we have shown to be directly proportional to the concentration of the solute. Based on the Bernulli equation and the Buger-Lambert-Beer law, one may conclude that an increase in the optical density of a solution leads to decreased flow of fluid, resulting in increased fluid pressure on the pipe wall. Given the fact that the aqueous outflow pathway may be considered as a system of pipes of various diameters, in which the flow is driven by the pressure difference between the start and end points of the system, the relationship (between (a) the optical density and velocity of the fluid, and (b) fluid pressure on the pipe wall) may be used to describe the flow of fluid in the eye. Conclusions Two absorption bands were found within the range of 190-300 nm in the spectra of AH samples obtained from the patients. Most patients of both groups did not differ in the shape and position of peaks and in the shape of these bands. This similarity can be explained by the fact that absorption of irradiation in the samples is caused by close concentrations of the same substances. However, it should be noted that the intergroup difference in the optical density at 202 nm (but not 267 nm) of the AH samples was statistically significant. Spectrophotometry can be regarded as a valuable adjunct in the diagnosis of patients with ocular disorders. The issue related to the optical density of the AH, determination of the levels of high-molecular weight components of the latter, and of the influence of these components on the velocity of AH flow and on the pressured exerted by the AH on the vessel walls is deemed to be important. Further research in these areas is warranted to facilitate the selection of optimal management strategy for patients with POAG. References
|